Reading and writing ‘GraphPad Prism’ files in R
Yue Jiang
2026-01-16
Source:vignettes/pzfx.Rmd
pzfx.RmdBackground
GraphPad Prism is a software application for scientific graphing,
curve fitting and statistical testing. It has been popular among
scientists, especially experimental biologists. The pzfx R
package provides an easy way to read data tables that are in GraphPad
Prism format (.pzfx files) into R and vise versa. Since
Prism5 (the current version as of mid 2018 is Prism7), Prism stores its
data tables in XML format and is possible to be parsed in
R. The pzfx package manipulates GraphPad Prism
XML files through functions provided by
xml2.
Main functionality
Reading
There are two main functions for reading. pzfx_tables
lists the tables in a .pzfx file. read_pzfx
reads one table into R from a .pzfx file.
We use a Prism example file exponential_decay.pzfx to
show how these two functions work. Here is the screen shot of this file
when opened in Prism. 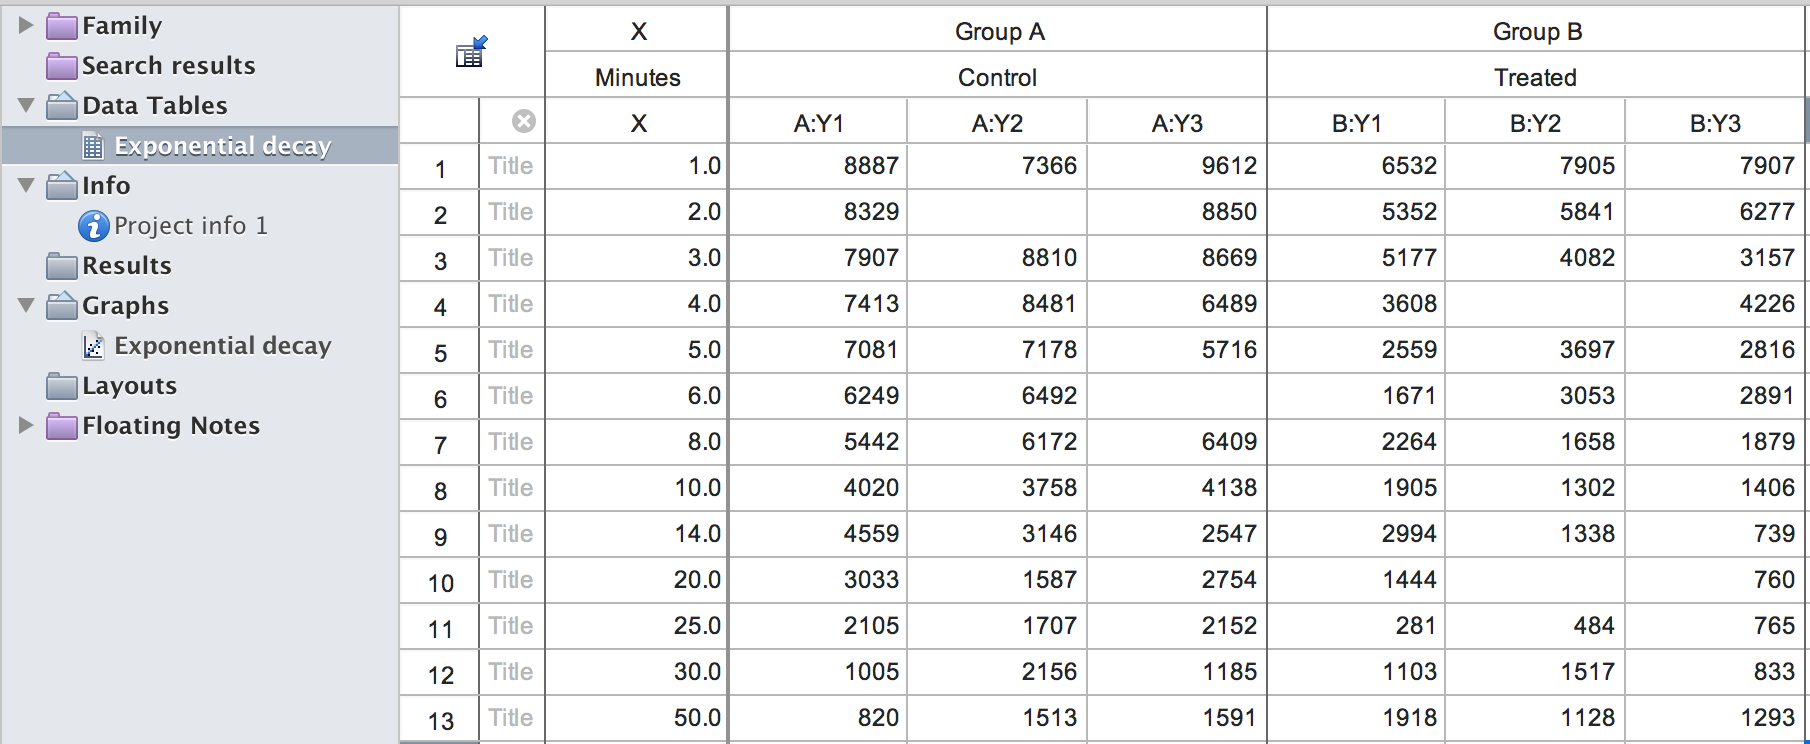
List tables from a .pzfx file:
library(pzfx)
pzfx_tables(system.file("extdata/exponential_decay.pzfx", package="pzfx"))
#> [1] "Exponential decay"
Read one specific table into R by table name:
df <- read_pzfx(system.file("extdata/exponential_decay.pzfx", package="pzfx"), table="Exponential decay")
head(df)
#>   Minutes Control_1 Control_2 Control_3 Treated_1 Treated_2 Treated_3
#> 1       1      8887      7366      9612      6532      7905      7907
#> 2       2      8329        NA      8850      5352      5841      6277
#> 3       3      7907      8810      8669      5177      4082      3157
#> 4       4      7413      8481      6489      3608        NA      4226
#> 5       5      7081      7178      5716      2559      3697      2816
#> 6       6      6249      6492        NA      1671      3053      2891
Read one specific table into R by table index (1-based):
df <- read_pzfx(system.file("extdata/exponential_decay.pzfx", package="pzfx"), table=1)
head(df)
#>   Minutes Control_1 Control_2 Control_3 Treated_1 Treated_2 Treated_3
#> 1       1      8887      7366      9612      6532      7905      7907
#> 2       2      8329        NA      8850      5352      5841      6277
#> 3       3      7907      8810      8669      5177      4082      3157
#> 4       4      7413      8481      6489      3608        NA      4226
#> 5       5      7081      7178      5716      2559      3697      2816
#> 6       6      6249      6492        NA      1671      3053      2891
Writing
There is a write_pzfx function for writing. It takes as
input a data frame or a matrix, or a named list of data frames or
matrices, and writes to a .pzfx file. To keep row names and
use them as row titles in .pzfx, specify argument
row_names=TRUE. To specify a column (column 1, “Col1” for
example) to be used as the “X” column, specify argument
x_col=1 or x_col="Col1".
tmp <- tempfile(fileext=".pzfx")
write_pzfx(df, tmp, row_names=FALSE, x_col="Minutes")
out_df <- read_pzfx(tmp, table=1)
head(out_df)
#>   Minutes Control_1 Control_2 Control_3 Treated_1 Treated_2 Treated_3
#> 1       1      8887      7366      9612      6532      7905      7907
#> 2       2      8329        NA      8850      5352      5841      6277
#> 3       3      7907      8810      8669      5177      4082      3157
#> 4       4      7413      8481      6489      3608        NA      4226
#> 5       5      7081      7178      5716      2559      3697      2816
#> 6       6      6249      6492        NA      1671      3053      2891
unlink(tmp)
Additional notes
Prism allows subcolumns. To accommodate this,
read_pzfxautomatically adds_1,_2etc to the original column name to account for sub columns if they represent replicates. It tries to infer the subcolumn types and adds appropriate suffix accordingly. For example, trailing_MEAN,_SD,_Nare added if subcolumns represent mean, standard deviation and number of observations.Prism does not require columns in a table to be of the same length. To accommodate this,
NAs are added if the columns are of different lengths.Prism allows user to exclude data by striking them out individual observations. To accommodate this, an option
strike_actionis available inread_pzfx. One can choose to delete these values withstrike_action="exclude", keep them with"keep", or convert them to a trailing “*” (as they appear in Prism) with"star". Note ifstrike_action="star"the entire table is converted to typecharacter.Prism allows special formatting of column names such as superscripts. When reading into R, column names with special formatting are converted to regular strings.
For writing, because R data frames and matrices don’t support hierarchical columns, the written out
.pzfxfiles can only be of type “Column” or “XY”, depending on whether the “X” column is specified byx_col.